A GC at a Series C SaaS company sent us her legal-ops dashboard last quarter. Seventeen KPIs on the front page. Matters opened, up 22% YoY. Matters closed, up 19%. Tickets resolved. Average time-in-queue, broken out by region. Hours per FTE. Annual NPS from "the business," 41, collected by a Survey Monkey form that 23 of 140 stakeholders bothered to finish.
The slides were beautiful. Her CFO had spent the last board meeting asking why outside counsel spend was up 31%. She had pointed at her dashboard. The CFO had pointed at the same dashboard and said none of these numbers answer that question. She wanted to know which numbers to keep.
Her mistake was not laziness; it was inheriting a template. The dashboard had grown an extra row every time a new function got created (compliance, privacy, ethics) without anyone going back to delete the rows that no longer earned their slot.
Our read: about six of the seventeen KPIs were worth keeping, and not the ones at the top. The dashboard was measuring legal team activity, not legal team value, and a sharp CFO can smell the difference at twenty paces.
The 2026 version of this conversation looks different, and it is being driven by a couple of pieces of data the GC's slide deck has not caught up with yet. BTI Consulting's Practice Outlook 2025 found that corporate counsel were on track to add 6.9% to outside counsel spending, the largest single-year increase in a decade.
The 2025 ACC Chief Legal Officers Survey found that 45% of CLOs planned to increase outside counsel spend, a 17-point jump year over year, while the median number of firms used dropped from 14 to 10. The 2025 CLOC State of the Industry Report found 83% of departments facing rising demand and AI adoption nearly doubling.
The work is going up, the spend is going up, the vendor count is going down, and the dashboards most departments inherited from 2019 cannot tell you whether any of that is good news.
The argument of this post is straightforward: most of what legal teams measure in 2026 is vanity, only six metrics actually predict business value, and the biggest mistake a Head of Legal can make is tracking matter volume.
The short answer: the legal department KPIs worth a board slide in 2026 are outside counsel spend per company FTE, outside counsel spend as a percentage of revenue, average contract turnaround time, self-serve resolution rate, litigation reserves versus outcomes, and cross-functional NPS. Each has a formula and a benchmark band below. Matter volume, hours worked, and tickets closed are activity counts, so keep them off the board pack.
TL;DR
Part of our in-house counsel guide series.
- Most legal department KPIs are vanity metrics. Matter counts, hours worked, and "tickets closed" measure team activity, not business value. They survive on dashboards because they are easy to count, not because they predict anything a CFO cares about.
- Six KPIs actually move the needle, drawn from four categories: spend control, risk reduction, velocity, and stakeholder satisfaction. The list is in section four. Everything else is supporting evidence at best.
- The biggest single mistake is tracking matter volume as a primary metric. It rewards intake instead of resolution and punishes any self-serve work the team enables.
- Benchmark against real sources. ACC's CLO Survey, the ACC/Major, Lindsey & Africa Law Department Benchmarking Report, CLOC's State of the Industry, and BTI Consulting's outlook reports are the four references a GC should keep on the desk. Anything else is a vendor white paper with selection bias.
- The board slide is one page, six numbers, four quarters, and a RAG status column. If it cannot fit on that page, it does not belong in the board pack.
How many KPIs does the post say belong on the board slide?
Why most legal department KPIs fail
Legal operations inherited its early metrics from the practice management vendors, and the practice management vendors inherited them from time-and-billing software. That lineage matters. Matter counts and time entries are easy to count because the underlying system was built to bill them. Whether they describe anything useful about the business is a separate question that nobody asked for a long time.
The result is a set of KPIs with a consistent failure mode: they measure how busy the legal team is, not whether the company is better off.
Take "matters handled per quarter." A higher number sounds good. It is, in practice, ambiguous in both directions. It could mean the business is generating more legal work (bad for spend) or that the legal team enabled fewer self-serve resolutions (worse for spend) or that intake got better at logging things that used to go to email (a measurement artifact, neither good nor bad).
The number cannot tell you which of those is happening, and a CFO who has been around the block knows it.
Hours worked has the same problem in a more honest costume. A team that worked 9,000 hours this quarter is either understaffed, inefficient, taking on more strategic work, or padding the timer. Without a denominator that ties hours to business outcomes, the number is theater.
The pattern repeats across the dashboards we see. Pure activity counts dressed up as performance metrics. A good KPI has three properties: it ties to a business outcome the CFO recognizes, it is hard to game without doing the underlying work, and it gets worse when something real gets worse.
Most legal dashboards fail the third test. The number goes up regardless.
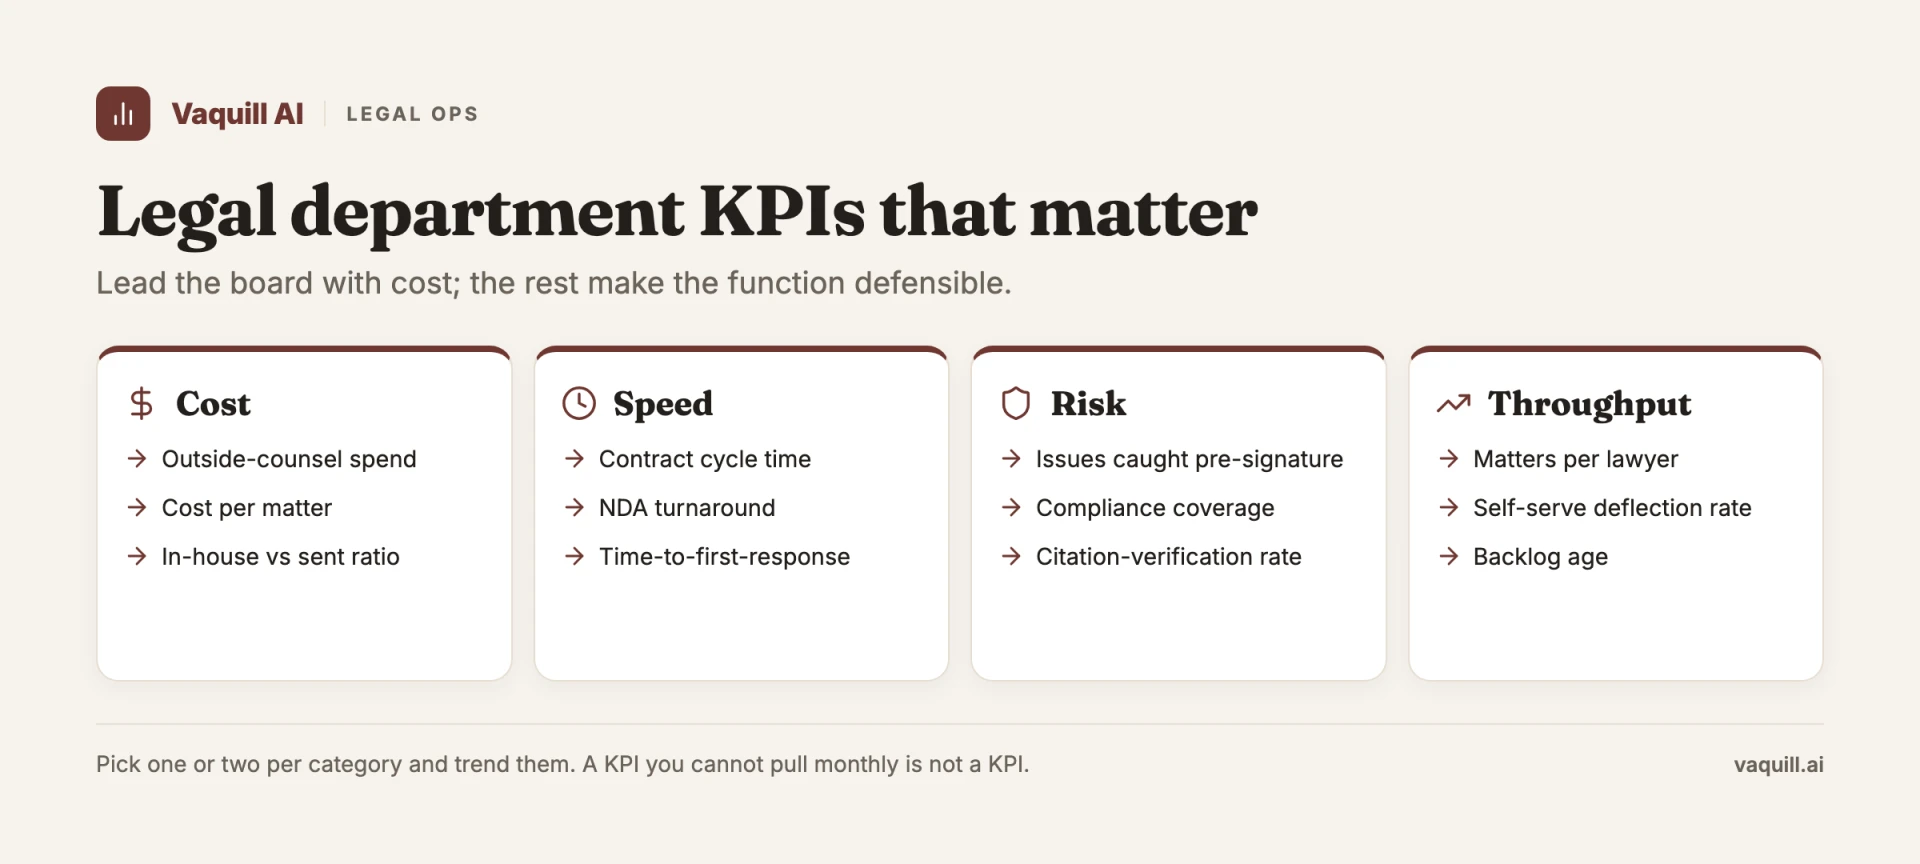
Four categories of legal-department KPI; lead the board with cost.
The four categories that matter
If you strip out the vanity and start from "what does this department exist to do," you end up with four categories. Every defensible KPI sits inside one of them.
Spend control. Legal departments are cost centers, and the CFO's first question is always "how much, and how does that compare to peers." The metrics here are outside counsel spend per FTE (the company's total headcount, not the legal team's), outside counsel spend as a percentage of revenue, matter mix between outside and inside resources, and e-billing rejection rate as a proxy for how seriously the team enforces its own guidelines.
The 2025 ACC/Major, Lindsey & Africa Law Department Benchmarking Report puts median total legal spend per company FTE in the low thousands of dollars, with significant variation by industry and company stage. Your number is meaningful only against that distribution, not against last year's internal target.
Risk reduction. Harder to measure, more important to get right. Litigation portfolio reserve adequacy (are reserves matching outcomes, or is finance taking surprise charges every quarter), contract turnaround time on the contracts that protect the company's largest exposures, compliance violation count, and regulatory inquiry trends.
The honest version of this category admits that risk reduction is partly counterfactual: a quarter with no major incident might mean the controls are working or might mean you got lucky, and a dashboard that cannot tell the difference is doing the GC a disservice.
Velocity. Intake-to-first-response time, matter cycle time by category, and contract approval time. World Commerce and Contracting benchmarks put average commercial contract cycle times in the 30 to 90 day range, with high-performing organizations hitting under two weeks for moderately complex B2B contracts.
Velocity matters because slow legal review is one of the most visible drags the legal team puts on the rest of the company, and it is one of the few categories where a CFO will accept investment in process or tooling on a straight payback argument.
Stakeholder satisfaction. Cross-functional NPS from the actual business teams you serve (sales, product, HR, finance), and time-to-decision on the requests those teams flag as urgent. NPS is a blunt instrument, but the alternative, surveying nobody, is worse.
The trick is to measure it quarterly with three questions, not annually with thirty, and to segment by stakeholder team so you can see who actually thinks legal is helping.
Inside those four categories, the question is which specific metrics are worth the slot on a one-page dashboard. The answer in our view is six.
The six KPIs that actually matter
The constraint we are imposing is real. A one-page legal dashboard for a board pack has room for about six numbers before it stops being a dashboard and starts being a wall of text. Six is also enough to cover all four categories without crowding any of them out. Here is the list we recommend, with a one-line rationale for each.
Every band below is labeled as either a published benchmark (named source) or a practitioner band (our observation across in-house teams, not a stated industry stat). Use them as a starting frame, then recalibrate against your own industry-and-revenue cohort in the ACC and CLOC reports.
| KPI | Formula | What good looks like (band) |
|---|---|---|
| Outside counsel spend per company FTE | Total outside counsel spend / total company headcount | Median total legal spend per company FTE runs in the low thousands of dollars (ACC/MLA Benchmarking, 2025); your peer band is industry-and-revenue specific |
| Outside counsel spend as % of revenue | (Internal + external legal spend) / company revenue | ~0.3 to 0.5% of revenue is a common mature-company range (practitioner band, varies widely by sector) |
| Average contract turnaround time | Counterparty-received date minus intake date, by contract type | Under 2 weeks for moderately complex B2B is high-performing; 30 to 90 days is the broad average (World Commerce and Contracting benchmarks) |
| Self-serve resolution rate | Tickets closed without lawyer reassignment / total intake tickets | Rising quarter over quarter is the read; absolute level is team-specific (practitioner band) |
| Litigation reserves vs outcomes | Carried reserve minus actual settlement/judgment, per matter | Small, symmetric gaps; persistent one-directional gaps signal mispricing (practitioner band) |
| Cross-functional NPS | % promoters (9 to 10) minus % detractors (0 to 6), per business team | Trend and open-text comments matter more than the absolute score (practitioner band) |
1. Outside counsel spend per company FTE. The cleanest single read on whether legal cost is in line with the rest of the company's scale. The ACC benchmarking data is your peer comparison, segmented by industry and revenue band. The denominator is total company FTE, not legal team FTE, because the question the CFO is answering is "what is legal costing us per head."
Formula: total outside counsel spend / total company headcount. Good looks like: at or below your ACC peer median for your industry-and-revenue band; the median total legal spend per company FTE runs in the low thousands of dollars (ACC/MLA Benchmarking, 2025).
2. Outside counsel spend as a percentage of revenue. Tracks the same expense against a different denominator, and this is where the two metrics start arguing with each other. A high-growth SaaS company can look great on per-FTE numbers (hiring outpaces legal spend) and terrible on percentage-of-revenue numbers (revenue is outpacing both); a mature manufacturing business can look the opposite way.
Read them together. Spend per FTE answers "is legal a sensibly priced internal service for the size of our company"; spend per revenue answers "is the company's risk profile changing faster than its top line."
The first informs headcount and tooling decisions. The second informs whether the business is taking on legal exposure faster than it is monetizing growth, which is the conversation the audit committee actually wants to have. A GC who reports only one of these is letting the CFO pick the framing.
Formula: (internal + external legal spend) / company revenue. Good looks like: a mature company often lands around 0.3 to 0.5% of revenue, though the spread by sector is wide, so read it as a trend against your own prior quarters (practitioner band, not a published stat).
3. Average contract turnaround time. The single metric most likely to be true to the rest of the business's experience of legal. If sales says legal is slow, this is what they mean.
Segment by contract type (NDA, MSA, vendor) because the medians are wildly different and an aggregate number hides the failure modes. The high-performer benchmark is under two weeks for moderately complex B2B; the laggard benchmark is two months and counting.
Formula: counterparty-received date minus intake date, measured per contract type. Good looks like: under 2 weeks for moderately complex B2B contracts; the broad average sits in the 30 to 90 day range (World Commerce and Contracting benchmarks).
4. Self-serve resolution rate. What percentage of intake gets resolved without a lawyer touching it, via playbooks, templates, self-serve portals, or AI-assisted intake. This is the single metric that punishes the vanity of matter volume the hardest.
A team whose self-serve rate is climbing is increasing leverage; a team whose matter volume is climbing while self-serve is flat is just becoming busier. Track both and you can see which is which.
The operational definition matters here, because this is the metric vendors most love to inflate. Our rule: a resolution only counts as self-serve if (a) the intake ticket closes without a legal user reassigning it to a lawyer, and (b) the requester confirms they got what they needed, either through a one-click feedback prompt or through a downstream event (NDA signed, vendor onboarded, policy acknowledged).
Pageviews on a playbook do not count. A counter that increments whenever someone opens a template document is theater.
Formula: tickets closed without lawyer reassignment / total intake tickets. Good looks like: a rate that climbs quarter over quarter while matter volume stays flat or falls; the absolute level is team-specific, so the trend is the signal (practitioner band).
5. Litigation reserves versus portfolio risk. Are the reserves finance is carrying matching the outcomes the matters are producing? A persistent gap, in either direction, means either the legal team is mispricing risk or finance is being defensive.
Either way the CFO needs to know. This is the one metric on the list that requires real coordination with the controller's office to produce honestly.
Formula: carried reserve minus actual settlement or judgment, tracked per matter and rolled up. Good looks like: small, symmetric gaps that net out near zero over a year; a persistent one-directional gap is the warning sign (practitioner band).
6. Cross-functional NPS. A score from each business team the legal department serves, collected quarterly with three questions, segmented by team. The score is less interesting than the trend, and the trend is less interesting than the open-ended responses. We have never seen a useful legal-ops conversation that started with "our NPS is 47." We have seen plenty that started with "sales NPS dropped twelve points last quarter and the comments are all about contract speed."
Formula: percent promoters (9 to 10) minus percent detractors (0 to 6), collected per business team. Good looks like: a stable or rising trend per team plus actionable open-text comments; chase the comments, not the headline number (practitioner band).
That is the list. Notice what is not on it: hours worked, matters opened, average lawyer experience, training hours completed, diversity scorecard. Some of those are worth tracking for HR or compliance reasons. None of them belong on the GC's board slide.
One more judgment call, the one nobody writes down. There is a metric your CEO or CFO will sometimes ask you to add, usually after they read a McKinsey deck on a flight. "Cost savings from AI tooling," typically. Or "matter automation rate."
The temptation is to oblige, because saying no to the CFO is uncomfortable. Do not. A KPI on the board pack carries the implicit promise that you can defend the number under cross-examination from the audit committee, and "AI savings" is a number that nobody can defend honestly in 2026, because the counterfactual (what would have happened without the tool) is unknowable.
Track it in the legal-ops report. Quote it as supporting evidence when you defend tooling spend. Keep it off the board slide.
The GC who learns to politely deflect this request is the one who lasts five years; the GC who indulges it is the one whose dashboard quietly becomes unreliable and whose budget conversations get harder every quarter.
Benchmarking sources worth reading
There are four sources we keep coming back to. Everything else is downstream of these or has selection bias problems that make the numbers untrustworthy.
The ACC Chief Legal Officers Survey, produced annually with FTI Consulting, captures what GCs themselves say about budget, headcount, and strategic priorities. The 2025 edition surveyed over 1,000 CLOs across 28 industries, and it is the closest thing the profession has to a primary source on what GCs actually care about.
Read each year's edition against the prior one; the year-over-year delta in the "what keeps you up at night" rankings is more useful than any single year's snapshot.
The ACC/Major, Lindsey & Africa Law Department Management Benchmarking Report goes deeper on the operational metrics: spend per FTE, internal versus external resourcing, technology spend, and staffing breakdowns by specialization. This is where you find the actual peer-comparison numbers for the six KPIs above.
The CLOC State of the Industry Report, produced in collaboration with Harbor, focuses on legal operations function maturity and adoption of specific practices: matter management, e-billing, AI tooling, vendor management. The 2025 report captured data from 186 organizations across 14 countries and found 95% of departments naming outside counsel and vendor management as a legal operations responsibility.
CLOC's 2026 edition documents rising legal demand outpacing budget and staffing growth, which is exactly the squeeze the six KPIs above are designed to make visible.
BTI Consulting's Practice Outlook and Litigation Outlook reports look at the same question from the law firm side. The 2025 outlook flagged the 6.9% spending increase before most in-house teams budgeted for it. BTI is where you find the demand-side signal that the spend numbers in your own e-billing system are catching up to.
Vendor white papers can be useful for color, but they have a selection bias problem that the four above mostly do not: the vendors survey their own customers. When the headline number tells you that companies using product X have legal costs 30% lower than the industry average, the honest read is that companies who buy product X may already have been efficient. Treat them as directional, not benchmark.
In a budget cycle, use these reports narrowly. You are not aiming to be best-in-class on every metric, because best-in-class on every metric is what a department three times your size looks like. Aim for median in your industry-and-revenue band on spend metrics, and clearly above median on the two or three operational metrics where your CEO has signaled a strategic priority (usually contract velocity or self-serve rate).
Walk into the planning meeting able to say "ACC puts our peer median at $X per FTE, we are at $Y, the gap closes if we hire one more inside counsel and cut Firm Z by 30%," not "we are below average and need more money."
A peer comparison without a specific action attached is a benchmark with a complaint glued to it.
What the board slide should show
If we have done our jobs above, the dashboard writes itself. Six metrics, four quarters of history, red/amber/green status, and one comment column for anything that needs context. Here is the shape.
| KPI | Q1 | Q2 | Q3 | Q4 | Status | Note |
|---|---|---|---|---|---|---|
| Outside counsel spend / company FTE | $X | $X | $X | $X | Amber | Litigation matter at vendor Y |
| Outside counsel spend / revenue % | X% | X% | X% | X% | Green | Tracking with peer median |
| Avg contract turnaround time (days) | X | X | X | X | Red | NDA queue grew 40% in Q4 |
| Self-serve resolution rate % | X% | X% | X% | X% | Green | Up from 18% to 31% YoY |
| Litigation reserves vs outcomes | $X | $X | $X | $X | Amber | One settlement outside reserve range |
| Cross-functional NPS | X | X | X | X | Green | Sales NPS up 9 points |
Here is the same slide filled in with illustrative numbers for a hypothetical Series C SaaS company (~140 FTE, ~$40M revenue), so you can see what a real one reads like. These are made-up figures for the worked example, not client data.
| KPI | Q1 | Q2 | Q3 | Q4 | Status | Note |
|---|---|---|---|---|---|---|
| Outside counsel spend / company FTE | $3,100 | $3,400 | $3,900 | $4,200 | Amber | One IP dispute drove the Q4 jump |
| Outside counsel spend / revenue % | 0.41% | 0.43% | 0.46% | 0.48% | Green | Tracking near peer median |
| Avg contract turnaround time (days) | 9 | 11 | 14 | 18 | Red | NDA queue grew 40% in Q4 |
| Self-serve resolution rate % | 18% | 22% | 27% | 31% | Green | Up 13 points YoY after playbook launch |
| Litigation reserves vs outcomes | -$20k | +$15k | -$10k | +$120k | Amber | One settlement landed above reserve |
| Cross-functional NPS | 38 | 41 | 44 | 47 | Green | Sales NPS up 9 points |
Read this slide and the story is legible in one pass: spend is creeping up but explained, contracts are slowing and need attention, and the self-serve investment is paying off. One page. Six numbers. The CFO can read it in thirty seconds and ask three intelligent questions. The board can scan it and tell you whether legal is in control of the things legal is supposed to be in control of. The categories cover spend, velocity, leverage, risk, and stakeholder experience. Nothing on the list rewards activity for its own sake.
What is missing matters more than what is on. No count of matters opened, no count of hours billed, no count of training certifications completed. Those numbers can live in a longer operational report that the legal-ops team reads. They do not belong in front of the board, because they answer the wrong question.
Common KPI traps to avoid
Three patterns show up over and over in legal dashboards, and all three are worth flagging because they are subtle enough to survive a casual review.
Gaming the metric. Any KPI with a target attached creates an incentive to hit the target without doing the underlying work. The classic version is contract turnaround time: if "turnaround" is measured from "first lawyer touch" to "sent to counterparty," the team learns to delay the first touch until the contract is almost done, which makes the metric look great and the business experience worse.
Define each KPI in a way that resists this. Turnaround should be intake-to-final, with the clock starting the moment a stakeholder submits a request (via form, Slack channel, or shared inbox) and stopping when the counterparty receives the document, including all internal handoffs in between.
Audit the clock quarterly by sampling ten matters and asking the requester when they actually filed, not when the system logged it. The gap between those two numbers is your gaming exposure; on most teams we see it sits between five and fifteen days.
A second pattern is more subtle and worse, because it looks like good news. We saw an in-house team report an outside counsel spend reduction of 18% over four quarters. Champagne. Then the litigation team called in February to say two major matters had been reclassified as "internal advisory" and shifted to a sister entity's budget.
No actual spend change, just a journal entry. The dashboard celebrated for six months before finance caught it during a year-end consolidation.
The fix is one column on the legal-ops report (not the board slide): total outside counsel spend across all entities that ultimately consolidate up to the parent, reconciled monthly to the GL. If your spend metric only covers the legal department's cost center, it is gameable by anyone with access to a cost-center code.
Ignoring business context. A spike in outside counsel spend is bad in a flat quarter and totally fine in a quarter the company closed two acquisitions and got into a regulatory dispute. The dashboard needs a comment column or the numbers will get read out of context every time.
The corollary: a "green" status on every metric in a quarter that should have been hard is not good news. It is a sign the metrics are not sensitive enough or the team is sandbagging the targets.
Not tying KPIs to budget. The point of the dashboard is to inform decisions, and the decision that matters most is next year's budget. If the dashboard cannot answer "what would happen to these numbers if we added two FTEs" or "what would happen if we cut the outside counsel budget by 15%," the dashboard is decorative.
The metrics need to be plumbed into the planning cycle, not just the board-review cycle. The departments getting this right are the ones whose GC can walk into the budget meeting with the dashboard, point at the self-serve resolution column, and say "this is what the new contract automation paid for, and here is what we would lose if you cut it."
Half of getting these six numbers honest is having the matter and intake data in one place to begin with. Vaquill AI handles matter management and the intake-to-resolution workflows underneath, so the self-serve rate, cycle time, and turnaround figures come off the same system the work actually runs through instead of a spreadsheet someone updates by hand.
Legal departments in 2026 face harder work and sharper budget conversations. The teams that thrive are the ones who picked six metrics they can defend, hooked them into the planning cycle, and stopped trying to impress anyone with seventeen. Cut your dashboard to six, audit your gaming exposure, and walk into your next board meeting with a number for each box in the table above.
FAQ
What are the most important legal department KPIs to track?
Six cover the ground that matters: outside counsel spend per company FTE, outside counsel spend as a percentage of revenue, average contract turnaround time, self-serve resolution rate, litigation reserves versus outcomes, and cross-functional NPS. Together they cover spend, velocity, leverage, risk, and stakeholder experience without rewarding activity for its own sake. Everything else belongs in a longer operational report, not the board pack.
How do you measure legal department performance?
Tie each metric to a business outcome a CFO recognizes, make it hard to game, and make sure it gets worse when something real gets worse. Pure activity counts (matters opened, hours worked, tickets closed) fail that last test because the number rises regardless of whether the company is better off. Pair a spend metric with a velocity metric and a leverage metric so no single number can be gamed in isolation.
What is the formula for legal spend as a percentage of revenue?
Divide total legal spend (internal plus external) by company revenue for the same period. A mature company often lands somewhere around 0.3 to 0.5% of revenue, but the spread by sector is wide, so read it as a trend against your own prior quarters and your ACC peer band rather than a single target. Track it alongside spend per company FTE, because the two answer different questions.
What is a good contract turnaround time?
Under two weeks for a moderately complex B2B contract is high-performing; the broad average across organizations runs 30 to 90 days (World Commerce and Contracting benchmarks). Measure it from intake to counterparty receipt, including every internal handoff, and segment by contract type because an NDA and an MSA have very different medians. An aggregate number hides the failure mode.
What legal KPIs should you avoid?
Matter volume, hours worked, and tickets closed. They measure how busy the legal team is, not whether the company is better off, and matter volume actively punishes any self-serve work the team enables. Skip "AI cost savings" on the board slide too, because the counterfactual is unknowable and you cannot defend the number under audit-committee questioning. Track those in the operational report instead.
How often should you report legal KPIs to the board?
Quarterly, on a single page: six metrics, four quarters of history, a red/amber/green status column, and one comment column for context. The operational detail (matter mix, utilization, e-billing rejections) can update more often in the legal-ops report the team reads, but the board sees the six-number version on the quarterly cycle.
What sources should I use to benchmark legal department KPIs?
Four references hold up: the ACC Chief Legal Officers Survey, the ACC/Major, Lindsey & Africa Law Department Benchmarking Report, the CLOC State of the Industry Report, and BTI Consulting's outlook reports. Vendor white papers have a selection-bias problem (they survey their own customers), so treat them as directional color, not benchmark data.
For related operational playbooks, see Outside Counsel Rate Benchmarks 2026, how to reduce outside counsel spend with AI, and Outside Counsel Guidelines Template. For the bigger picture on tooling, see how AI is transforming in-house legal teams. For the intake, matter management, and reporting workflows that produce these six KPIs, see matter workspaces, or try Vaquill AI free for 7 days.
New legal AI guides, weekly.
Further Reading
Your First Legal Hire: Building an In-House Function With AI
Read postHow to Reduce Outside Counsel Spend With AI in 2026
Read postLegal AI for Chief Legal Officers (CLOs) in 2026
Read postRolling Out Legal AI to Your Team (Adoption Playbook)
Read postAI Compliance Check: CCPA, GDPR, and SOX for In-House Teams (2026)
Read post12 Best Legal AI Tools for In-House Counsel (2026)
Read post
Co-Founder & CEO · Attorney
Arshita leads product and strategy at Vaquill, building the legal AI suite that solo, small-firm, and in-house US lawyers use to run a matter end to end.